Skip to content
  • 24/7 Support
  • Our Platform
    • How it Works
    • Integrations
    • Partner Program
      • Become a Reseller
      • Third Party Support for POS
      • Refer a Lead
    • Products
      • Gift Card
      • Loyalty Programs
      • GivexPOS
        • QSR
        • Restaurant
        • Retail
        • Sports Venues
      • Uptix Ticketing
      • GivexPay
  • Company
    • About Us
    • Careers
    • Investor Relations
      • Governance
      • Financial Reports
      • News & Events
      • Analyst Coverage
  • Blog
    • News & Insights
    • Case Studies
    • Events
    • Investor News
  • Contact Us
  • Book a Demo
Book a Demo

The Power of Analytics: Here’s How Reports Can Save Your Bottom Line!

Date June 14, 2021

Author Sonya Hoshmand

Share

  • Share on LinkedIn - opens in a new tab LinkedIn
  • Share on Twitter - opens in a new tab Twitter
  • Share by Email
  • Copy URL Link Copied

Givex continuously comes out on top when it comes to analytics and reporting. No matter the product you have, our Analytics tool provides detailed graphs that identify areas of efficiency and improvement. Givex Analytics is a great way to gain an understanding of your business does over time to help you better understand how products, employees, and stores are performing. This allows you, the business owner, the ability to constantly analyze and improve upon your business as trends and behaviors change over time.

The bigger question always is – now that you have the tech, how do you use it to your advantage?

Here are a few of our client’s favorite Givex Analytics tools and reports, but we always encourage you to explore the tool and find out what works for you. Don’t forget to bookmark your favorites so you can keep up to date on what matters most for your business!

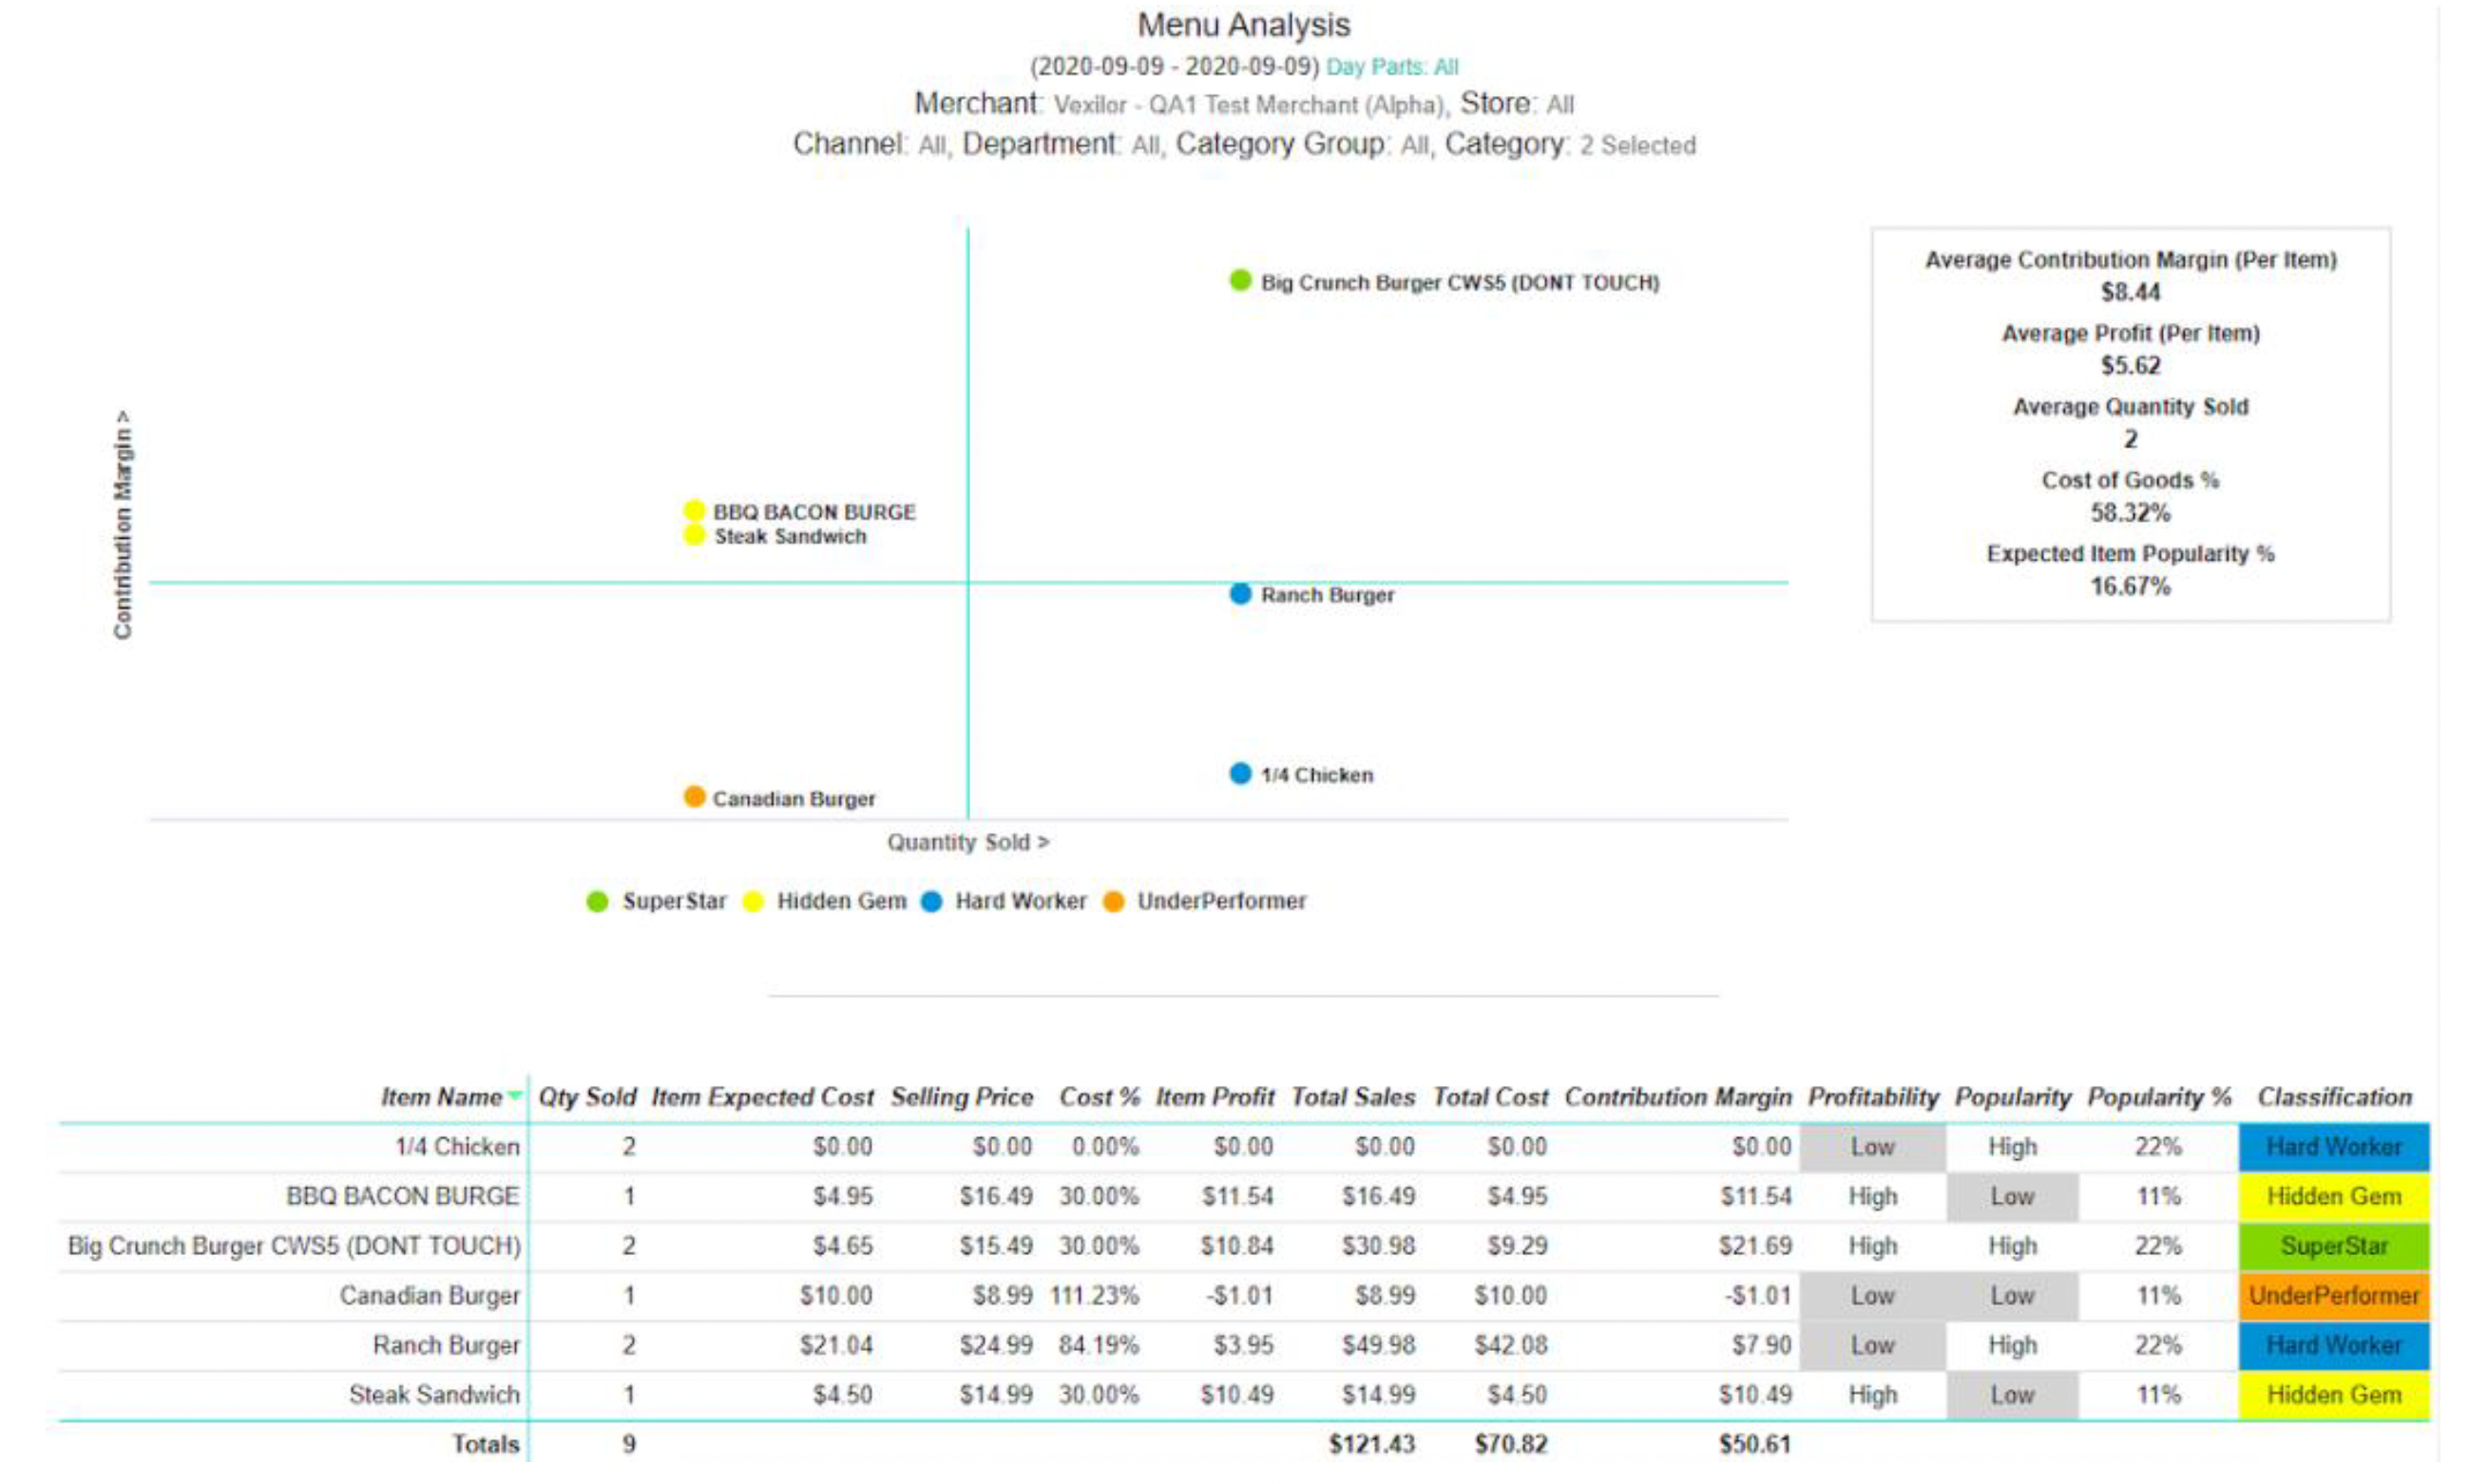
Menu Engineering Analysis

Food waste has always been a concern to restaurant owners, but many cannot afford any waste throughout the pandemic. Looking at costs, sales, and profit, this tool identifies all-stars and hidden gems on your menu, and highlights items that are duds – either due to low profit and/or low sales. Trim your menu and focus your marketing energy to get the best results! Understanding margins and ways to reduce your menu has never been so vital for the lifeline to many restaurants.

menu engineering analysis

Pivot Analysis

Setup your own tables and find the information that will help you the most! You can create custom reports here and once they’re created and bookmarked, you can retrieve the same data points at any time without having to rebuild your reports. Additionally, these reports can be charted in a variety of ways to give you a fully customized experience!

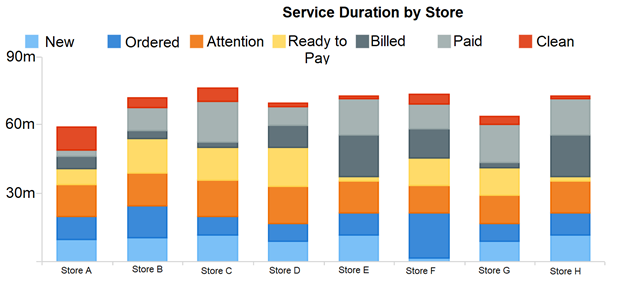
Service Time Analysis

Dubbed by a client as the “holy grail” of charts, this option shows you the duration of orders and time spent at each stage of the order’s life, aggregating these points into actionable insights by store, group of stores, or the whole enterprise. This highlights the areas of possible inefficiency or locations/shifts that may need more training to better meet the overall average or set service time objectives.

Whether you are in lockdown or businesses in your area are starting to open up, we know the importance of utilizing your data to make the best decisions for your business. Want to learn more on how Givex Analytics can help you understand your business better? Contact your sales representative or reach us here.

Related Company News

See all
  • Date January 19, 2023

    Author Lauren Moorman

    Givex to Exhibit Uptix Stored Value Solution and Mobile Patron Portal at International Ticketing Association (Intix) Conference and Exhibition from January 24 to 26, 2023

  • Date January 13, 2023

    Author Lauren Moorman

    Givex to Exhibit Unattended Retail Functionality and Evolution of Branded Currency in the Metaverse at NRF 2023, Retail’s Big Show, from January 15 to 17

  • Date January 5, 2023

    Author Lauren Moorman

    Givex Corp. Celebrates Strong Performance for the First Nine Months of 2022 with Three Acquisitions, and a 29% Increase in Revenue and an Increase of 22,000 New Merchant Locations Over the First Nine Months of 2021

TSX: GIVX

OTCQX: GIVXF

TSX: current price

Join our newsletter to stay up to date

By clicking the above button you are confirming that you agree with following our Privacy Policy.

This field is for validation purposes and should be left unchanged.
  • Our Platform
    • Book a Demo
    • How it Works
    • Integrations
    • Partner Program
  • Products
    • Gift Card
    • Loyalty Programs
    • GivexPOS
    • Uptix Ticketing
    • GivexPay
  • Company
    • About Us
    • Investor Relations
    • Careers
    • Contact Us
    • News & Insights
  • Already a Client?
    • 24/7 Support
  • Follow Us
    • YouTube
    • LinkedIn
    • Twitter
© 1999-2023 Givex Corporation. All Rights Reserved.
  • Privacy Policy
  • Policies
loading

Please wait while you are redirected to the right page...

Please share your location to continue.

Check our help guide for more info.

share your location

Region

  • North America
  • South America
  • Europe
  • Asia
  • Oceania

Language

  • Chinese (Simplified)
  • English
  • French
  • Portuguese
  • Spanish